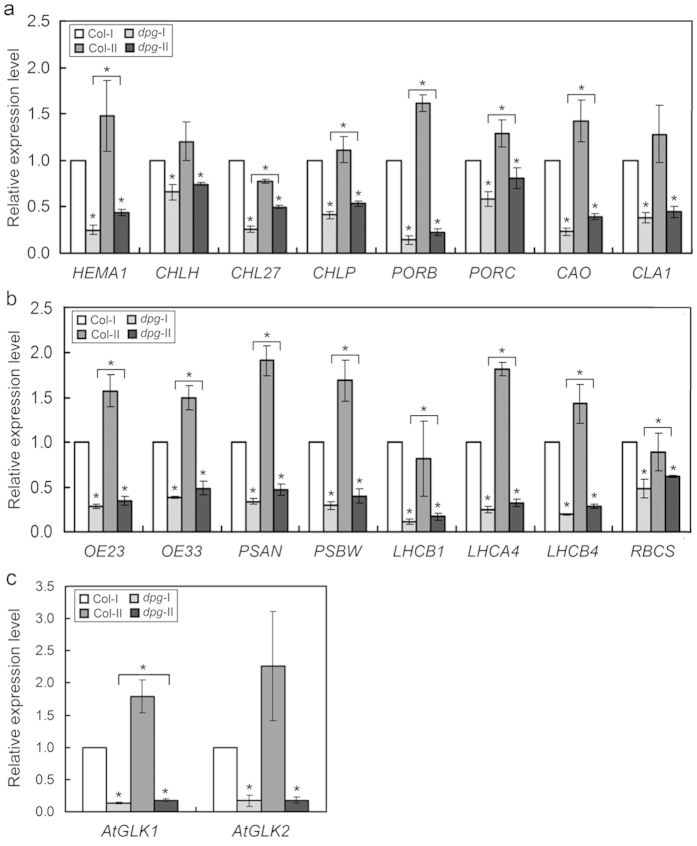
Figure 8. Effects of the AtDPG1 mutation on the expression of nuclear-encoded photosynthetic genes.
(a) The expression levels of nuclear-encoded genes that are critical for chlorophyll biosynthesis (HEMA1, CHLH, CHL27, CHLP, PORB, PORC, CAO, and CLA1). (b) The expression levels of nuclear-encoded photosynthetic genes (OE23, OE33, PSAN, PSBW, LHCB1, LHCA4, LHCB4, and RBCS). (c) The expression levels of nuclear-encoded GLK transcription factor genes (AtGLK1 and AtGLK2). The terms dpg1-I and dpg1-II refer to the leaves that were albino or pale-green in 21-day-old and 35-day-old dpg1 mutants, respectively. The transcript level of each gene was set to 1.0 in the leaves from a 21-d-old wild type plant. The bar graphs show the relative expression levels, as determined by the comparative CT method and normalized with the expression of the ACTIN2 gene. The error bars indicate the interval delimited by 2–(ΔΔCT ± SD). The asterisks indicate ΔCT values significantly different from those of control in a Mann–Whitney U-test (P < 0.05).

