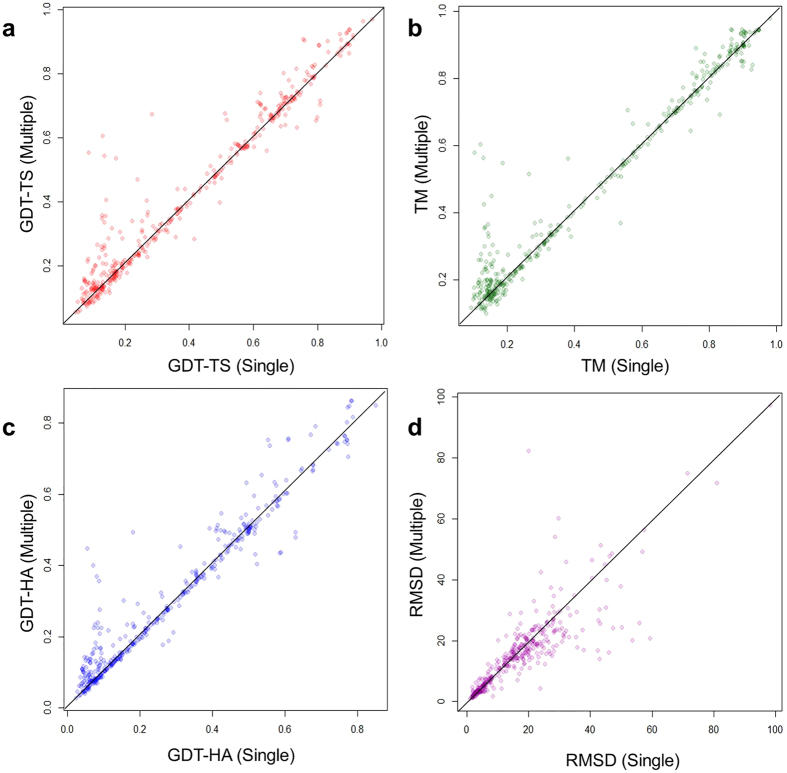
Figure 2. The improvements or losses of GDT-TS score, TM-score, GDT-HA score and RMSD of the models predicted by MTMG using the first single templates and multiple templates on individual CASP11 targets.
The scores of multi-template models are plotted against single-template models. X-axis represents the scores of single-template models and Y-axis represents the scores of multi-template models.

