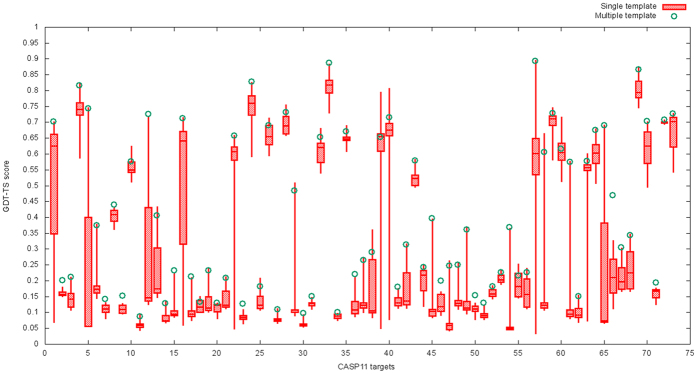
Figure 3. The boxplot of GDT-TS scores of the models predicted by MTMG for each of 73 CASP11 domains using each single template and multiple templates.
The box plot denotes the maximum, 75% quartile, mean, 25% quartile, and minimum score of the models constructed from each single template for a target. The small green circle denotes the score of the model constructed from multiple templates.

