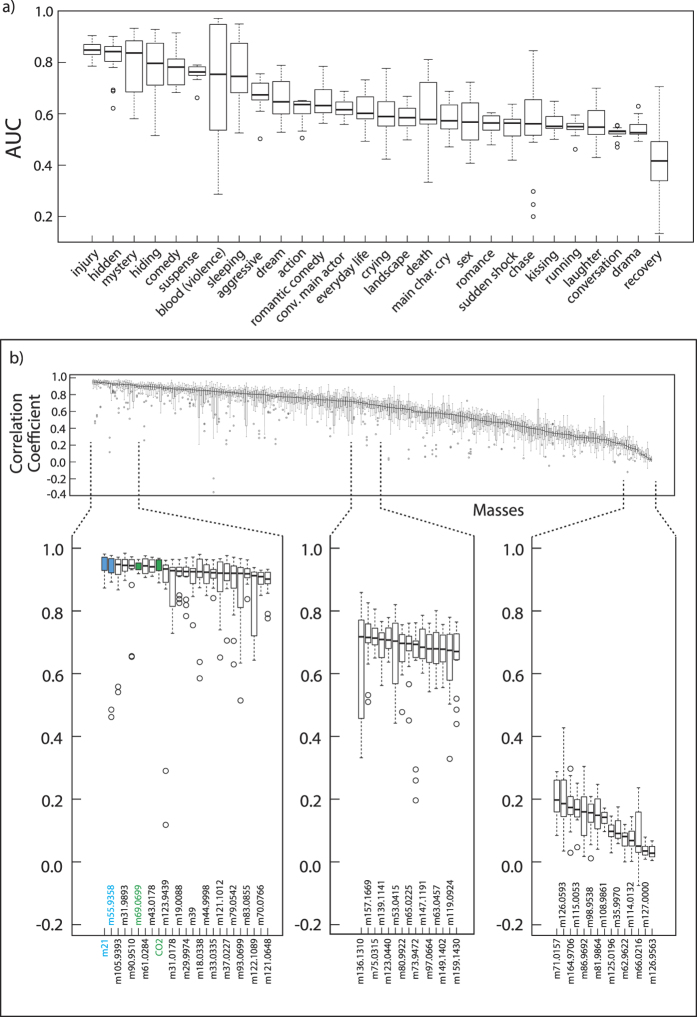
Figure 3. Shown are the results when two thirds of the whole film screening dataset is randomly selected (15 times) and the resultant model tested on the remaining third.
The boxes indicate the extent of 25% of the data either side of the median (solid line). The dashed vertical line represents the lowest/highest datapoints that are still in the 1.5 interquartile range while the circles are outliers. (a) shows AUC which expresses the ratio between true positives (when the model correctly predicted labels based on mass decision trees) and false positives (backward prediction). A random prediction produces an AUC value of 0.5. (b) shows the ability of an individual mass to be predicted by the labels (forward prediction). The performance of this prediction versus the real value for VOC mixing ratios is given as the Pearson’s correlation coefficient (r). High correlation coefficients indicate the predictive model was successful for that particular species, and not that all species with high correlation coefficients are inter-correlated.

