
Figure 1.
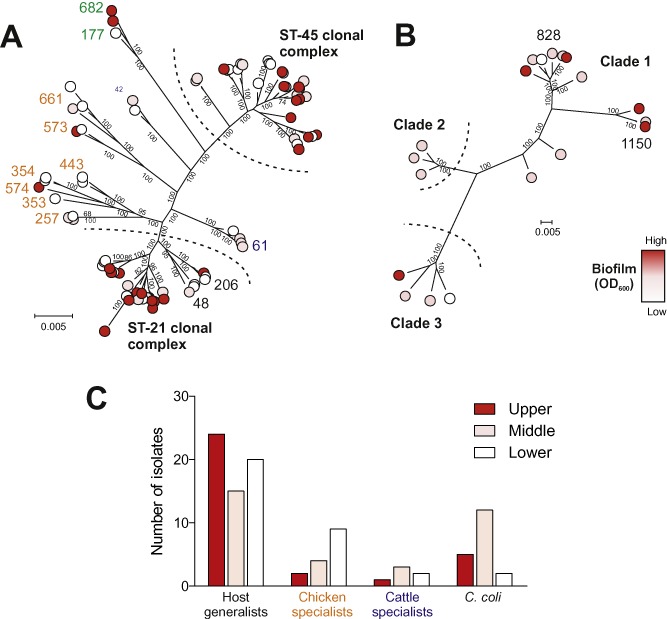
Genetic relatedness and biofilm formation of C . jejuni and C . coli isolates. Population structure of (A) C . jejuni and (B) C . coli with each isolate labelled as belonging to the upper (red; OD 600 above 0.272), middle (pink; OD600 between 0.201 and 0.272) or lowest (white; OD600 below 0.201) 33rd percentile of biofilm formers based upon phenotype assays. MLST clonal complexes coloured according to the common isolate source for C . jejuni generalists (black), cattle specialists (blue), chicken specialists (orange) and wild bird specialists (green). Trees were based on 761 381 and 1 018 234 bp core genome alignments for C . jejuni and C . coli, respectively, calculated using an approximation of the maximum likelihood algorithm. The scale bar represents the average number of polymorphisms per site. Local support values on each branch were calculated with default values in FastTree2. Values reflect the reliability of each split in the tree and were estimated using the Shimodaira–Hasegawa test on the three alternate topologies around that split, at a default re‐sampling rate of 1000 re‐samples for each split. (C) Biofilm formation scores in four major ecological groups of C ampylobacter including host generalists, chicken specialists, cattle specialists and C . coli. The proportion of isolates in the upper, middle and lowest biofilm formation percentile in these four ecological groups is statistically different (χ2 test; P = 0.0116).