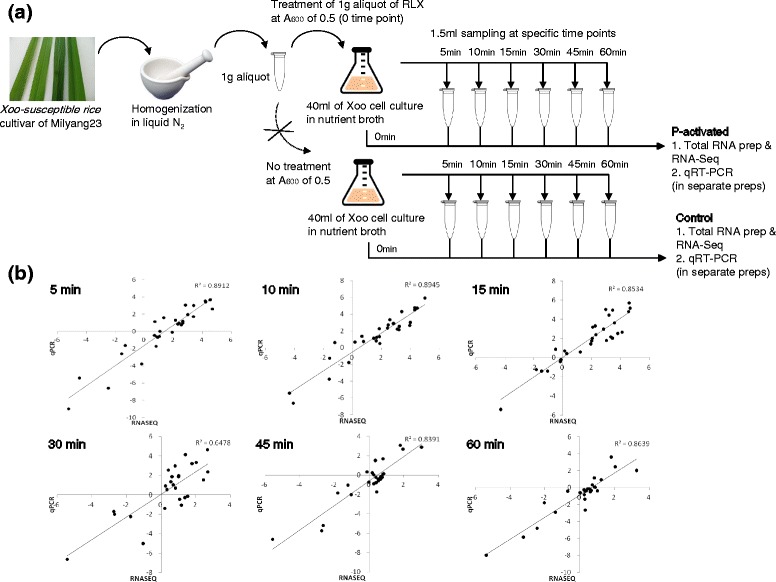
Fig. 1.

a Schematic representation of the in vitro assay system and sampling for RNA-Seq and qRT-PCR. b Comparison of transcription levels by RNA-Seq and qRT-PCR. The relative transcription levels for 28 randomly selected genes from RNA-Seq data were verified by qRT-PCR. The log2-scaled values from qRT-PCR were plotted against the log2-scaled values from RNA-Seq data. The correlation coefficient (R2) of the datasets was between 0.65 and 0.89
