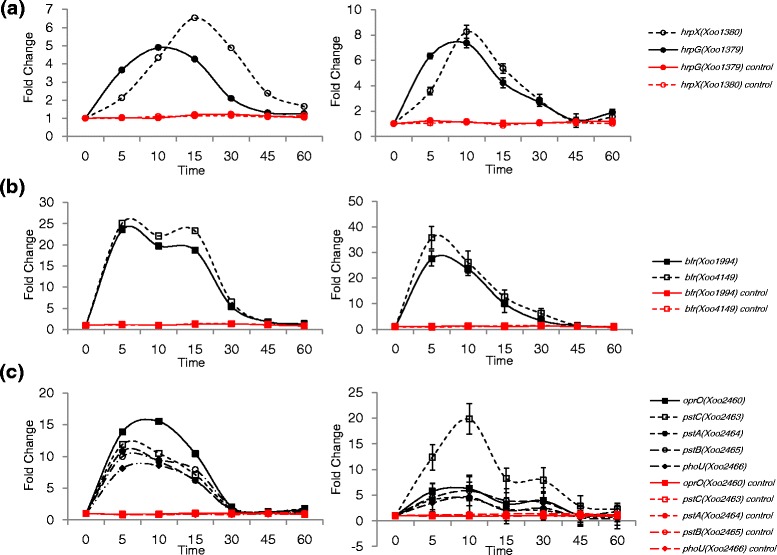
Fig. 3.

Time-resolved expression patterns of hrpG and hrpX genes, iron-uptake bacterioferritin genes and Pi-uptake genes. a RNA-Seq expression data of hrpG and hrpX (left) and qRT-PCR expression data of hrpG and hrpX (right). b RNA-Seq expression data of two bacterioferritin genes, Xoo1994 and Xoo4149 (left) and qRT-PCR expression data of Xoo1994 and Xoo4149 (right). c RNA-Seq expression data of oprO, pstC, pstA, pstB and phoU (left) and qRT-PCR expression data of oprO, pstC, pstA, pstB and phoU (right). The unit of time is min. Red lines indicate the expression levels of genes in the control (untreated) Xoo cells. Y-axis represents fold-change
