Fig. 1.

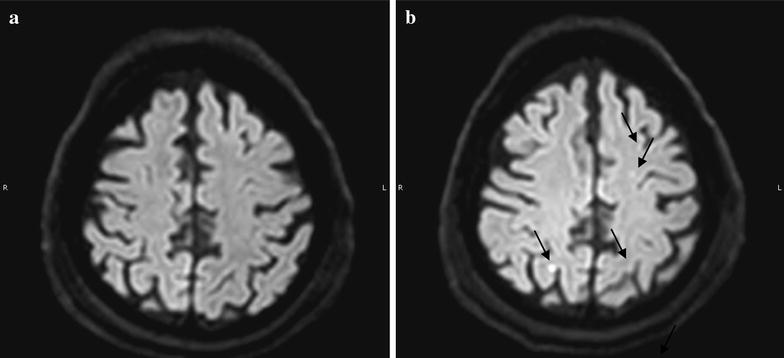
RMN study: representative figure of the RMN performed before a and 24 h after b cell administration. In b the arrows indicate several spotty lesions

RMN study: representative figure of the RMN performed before a and 24 h after b cell administration. In b the arrows indicate several spotty lesions