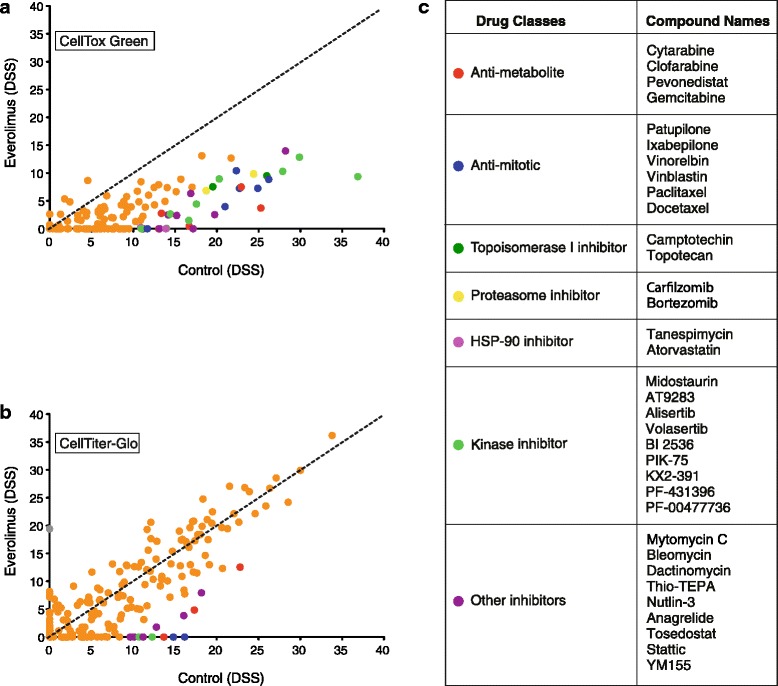
Fig. 6.

An mTOR inhibitor antagonizes the effect of diverse classes of drugs in CAL-51. Scatter plot of DSS scored for combinatory effect of different compounds along with everolimus (10 nM) (Y-axis) on CAL-51 cell line compared to the single agent effects (X-axis). Plot a represents the DSS computed using cell death assay and plot b represents cell viability assay. Data points with DSS difference more than 10 are highlighted with different colors representing different classes of drugs as listed in the color legend. c Compounds whose effect is inhibited when combined with everolimus, as highlighted in panels (a) and (b)
