Fig. 3.

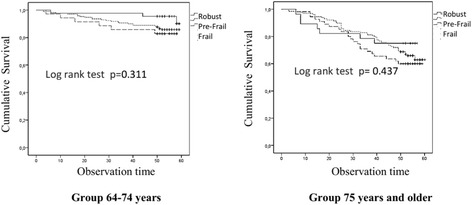
Kaplan – Meier survival curves comparing overall survival in frail, pre-frail and robust persons according to the Fried model after excluding participants with stroke, MMSE < 18, or a history of Parkinson’s disease or cancer

Kaplan – Meier survival curves comparing overall survival in frail, pre-frail and robust persons according to the Fried model after excluding participants with stroke, MMSE < 18, or a history of Parkinson’s disease or cancer