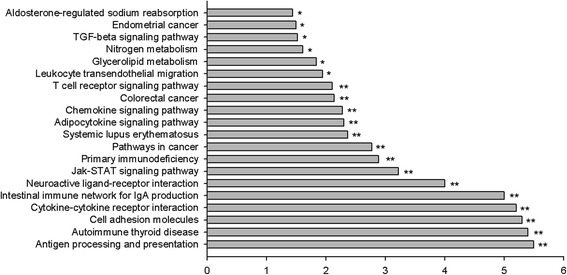
Fig. 4.

Signal pathway enrichment analysis of fetal intestine by HF diet relative to CON diet (n = 4 subpools/group). The pathway terms were according to the down-regulated genes for certain biological processes, enriched categories are those identified as significantly enriched after multiple testing. * P < 0.05, ** P < 0.01. The value by horizontal axis resulted from negative value of Log (enrichment test P value, base 10)
