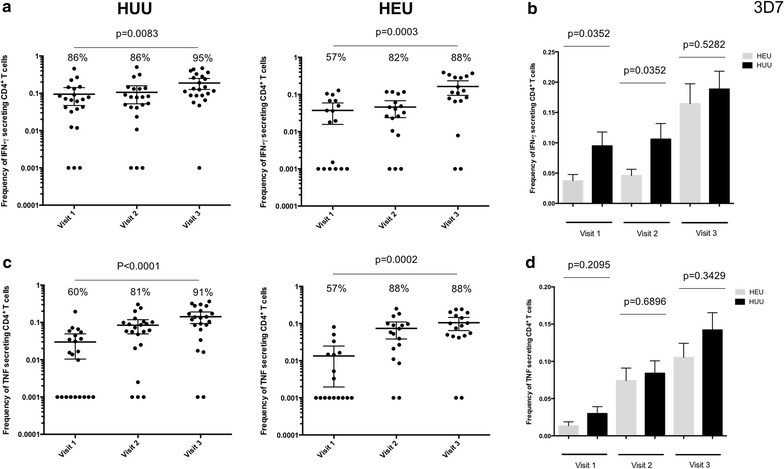
Fig. 3.

Frequency of PMA/Ionomycin stimulated CD4+ T cells in HEU and HUU children at different ages. a Total percentage of all IFN-γ cytokine producing CD4+ T cells was determined in HEU children and compared to HUU children at 6, 12 and 18 months of age. b Histogram comparing total percentage of all IFN-γ cytokine producing CD4+ T cells between HEU and HUU children overtime. c Total percentage of all TNF cytokine producing CD4+ T cells was determined in HEU children and compared to HUU children at 6, 12 and 18 months of age. d Histogram comparing total percentage of all TNF cytokine producing CD4+ T cells between HEU and HUU children overtime. X-axis represents time of visit. Black horizontal bars represent (a, c) mean with confidence intervals or (b, d) mean with SEM. Statistical significance was determined if p value was equal to or less than 0.05
