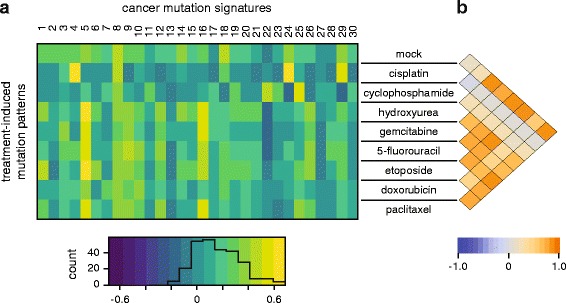
Fig. 6.

Correlation of drug-induced mutation patterns with mutation signatures identified in cancer. a Heat map of the Pearson correlation coefficient between triplet base mutation patterns induced by the cytotoxic treatment adjusted to human triplet frequencies (rows) and the 30 confirmed mutational signatures identified in human cancer [43]. The heat map key is shown at the bottom, with an overlaid histogram indicating the number of cells in each value range. b Heat map showing Pearson correlation coefficients between each pair of treatment-induced mutational patterns
