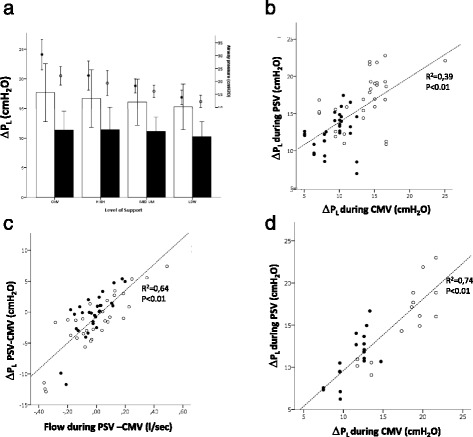
Fig. 2.

a Pressures (transpulmonary pressure swings [ΔPL] on the left, shown as bars and standard deviation), versus the level of support (high, medium, or low). It shows that, by contrast with airway pressure, ΔPL swings during inspiration were similar and not statistically different between controlled mechanical ventilation (CMV) and any of the support levels. Closed symbols represent mean values during inspiration, and open symbols show maximum values during inspiration. The correlation between the value recorded during CMV and pressure support ventilation (PSV), albeit significant, was poor (b). The difference between the measurement of ΔPL obtained during CMV and PSV was explained largely by the corresponding difference in the inspiratory flow (c), as shown by the highly significant correlation. Indeed, when the analysis was restricted to the breaths with similar inspiratory flows (i.e., with an absolute difference less than 0.1 L/minute) (d), the correlation of ΔPL obtained during CMV and PSV became very tight
