
Fig. 3.
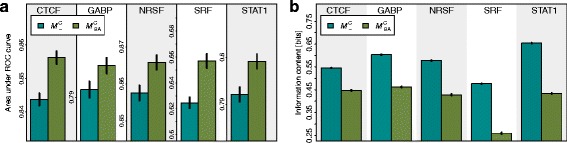
Comparison of models and . a Mean classification performance and standard error of the two models and quantified by the area under the receiver operating characteristic curve. We find for each of the five data sets a significantly increased classification performance for compared to . Examples for ROC curves are shown in Additional file 1: Figure S10, Figure S11, Figure S12, Figure S13, Figure S14 and Figure S15. b Mean information content and standard error of the motifs predicted by the two models and . We find for each of the five data sets a significantly decreased information content in motifs predicted by compared to (p<4.0×10⁻¹⁸)