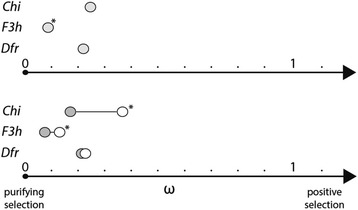
Fig. 3.

Patterns of variation in the dN/dS ratio (ω) across genes and between pigmented and unpigmented lineages. The upper panel shows ω values for the single ratio model for each of the three loci (see also Additional file 4: Table S3). * represents a locus with a significantly lower ω value than the other two loci. The lower panel shows ω values for pigmented (dark gray dot) and unpigmented (white dot) lineages under the two-ratio model. * represents cases in which the unpigmented lineages have significantly higher ω values
