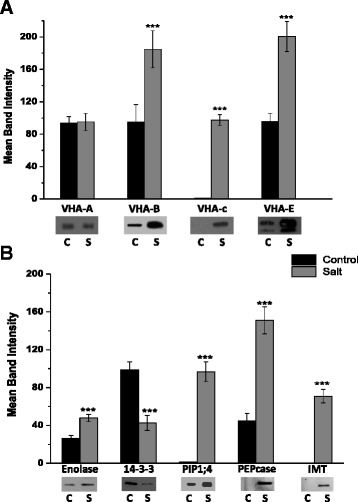
Fig. 2.

Western blot analysis of EBC extracts for validation of proteomics results. Graphical representation of mean band intensity (top) and western blots (below) of EBC extract total protein isolated from control (C, black bars) and salt-treated (S, grey bars) M. crystallinum plants. Blots were probed with; (a) polyclonal antibodies against the subunits of the V-ATPase (VHA-A, VHA-B, VHA-c and VHA-E), or (b) polyclonal antibodies against the glycolytic enzyme enolase, ENO; the 14-3-3 general regulatory factor protein, 14-3-3; the plasma membrane aquaporin, PIP1;4; the CAM enzyme phosphoenolpyruvate carboxylase, PEPC and inositol methyl transferase, IMT. Western blot analysis was carried out as described in the Methods section. Blots are representative of three independent experiments. Unpaired two-tailed Student’s t-test (p ≤ 0.05) was performed on the mean band intensity data to determine the significance difference
