
Fig. 3.
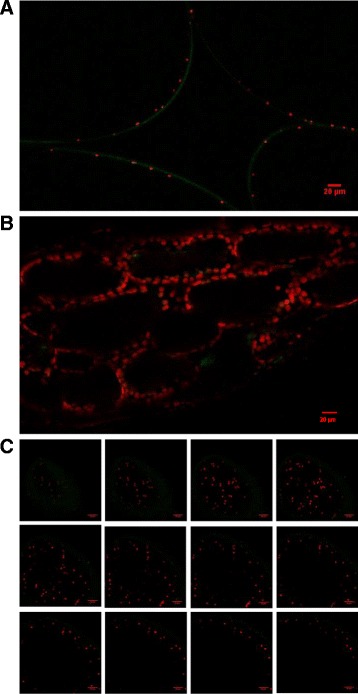
Visualization of EBC chloroplast autofluorescence by confocal laser scanning microscopy. Stem sections from salt-treated plants were submerged in water and images were obtained using an Olympus FV1000 confocal laser scanning microscope using an XLPLN 25X W NA:1.05 water immersion objective lens. Laser wavelength 1 = 488 (green) cell wall autofluorescence, Laser wavelength 2 = 635 (red) chloroplast autofluorescence. (a) Chloroplasts in EBC and (b), mesophyll cells. (c) Each panel is a single confocal section taken from a Z-stack of 12 confocal images acquired at 20 μm intervals