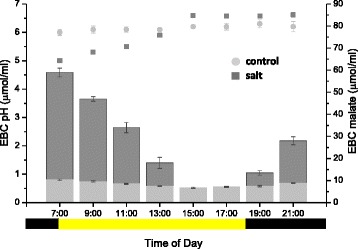
Fig. 4.

Measurement of pH and malate in EBC extract. Malate (bar graphs) and pH (scatter plot) were measured in leaves of control (light grey bars and symbols) and salt-treated (dark grey bars and symbols) plants at 2 h intervals from 7:00 to 21:00. The yellow horizontal bar represents the light period and black bars represent the dark period. Values are expressed as means of three independent experiments with standard deviation (SD) shown not exceeding 10 %
