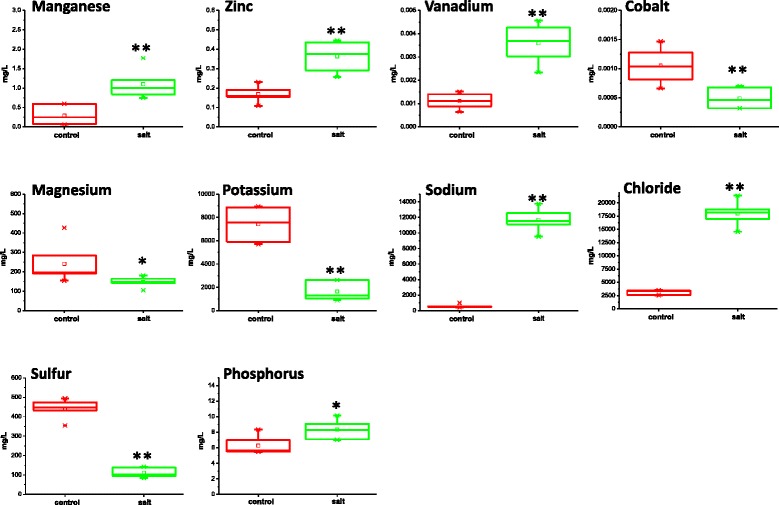
Fig. 5.

Box plots of the significant changes in ion concentration of EBC from control and salt-treated plants. For each concentration, the box represents the interquartile range (IQR), the bisecting line represents the median, the square symbol represents the mean, the whiskers represent the 95th and 5th percentiles, and the X symbols represent the maximum and minimum values. Elements which are significantly different between treatments with a P < .01 are designated **, while those significantly different with P < 0.05 are designated *
