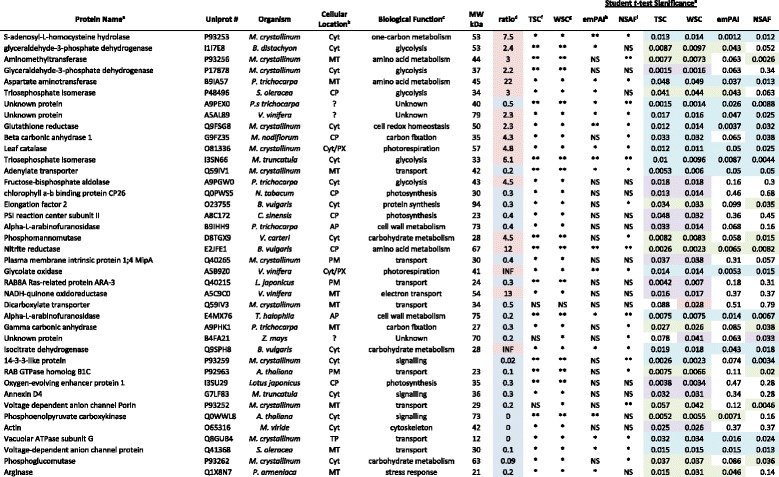
Table 2.
Salt-responsive proteins identified by GeLC-MS Label Free Quantitative Proteomics

aProtein names, bGO cellular location and cGO biological function annotations are taken from the Uniprot database recommended name and annotation. Cyt-cytoplasm, MT-mitochondria, CP-chloroplast, PX-peroxisome, AP-apoplast, PM-plasma membrane, TP-tonoplast
dAverage ratio of abundance of salt-treated spectra relative to the untreated control represent data from three independent experiments. Blue – decrease in abundance, Red – increase in abundance. For those proteins where values are missing (ie. 0), as spectra for the protein were not detected in any biological replicates of the sample, values for fold change will be reported as either 0 or infinity (INF).
eSignificance of the changes were calculated using Students t-test as a measure of confidence for the ratio of each spot measured. ** p < 0.01, *p < 0.05, NS - not significant. In the case of total spectral counts (TSC; unweighted spectral counts), the spectras are counted in each of the proteins it is assigned to. For the weighted spectral counts (WSC) the spectra is only assigned to a single protein with the most evidence. Blue highlight indicates that the change was significant using all four methods; Green for three out of four; Purple for two out of four and red for only a single method.
fTSC, total spectra count.
gWSC, weighted spectra count
hemPAI, exponentially modified protein abundance index
iNSAF, normalized spectral abundance factor
