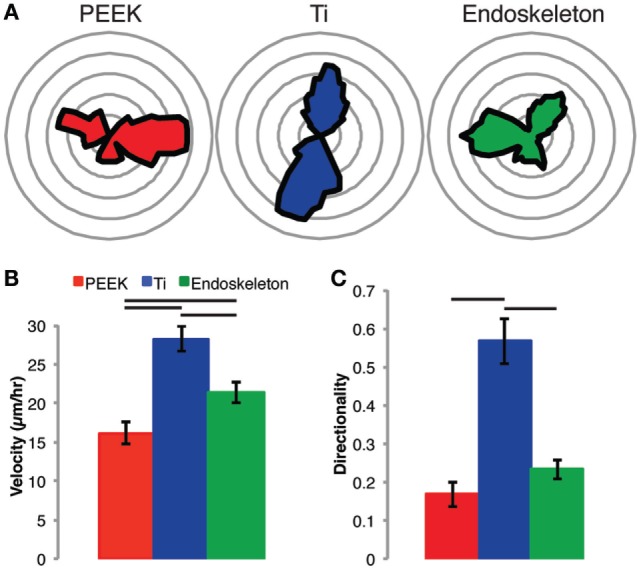
Figure 4.

Stem cell migration on each surface was assessed from 6 to 18 h post-seeding. The results demonstrate random migration on the PEEK and acid-etched endoskeleton surfaces indicated by the rose plots in (A), a histogram of the angle of migration for each cell monitored in (B), and the graph of directionality in (C), which demonstrates significance between PEEK and acid-etched endoskeleton surfaces when compared to the smooth titanium surface. Furthermore, the non-random migration on smooth titanium followed the grooves created by milling the surface, and this non-random migration resulted in an expected velocity increase, which was significantly higher than both the PEEK and acid-etched endoskeleton surfaces. Between the two surfaces demonstrating random migration, the MSCs on the acid-etched endoskeleton surface demonstrated a significantly higher velocity than those on PEEK. Significance, p < 0.05, is demonstrated by bars between groups in (B,C).
