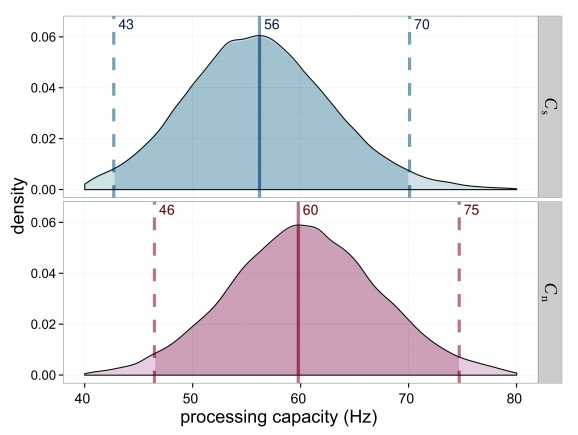
Figure 11.
Estimated processing capacities (C) for Experiment 2 in the salience condition (Cs, in blue) and the neutral condition (Cs, in red). The difference of 0 is in the highest density interval (HDI) if both distributions are subtracted, which indicates that the overall processing capacity was similar in both conditions.

