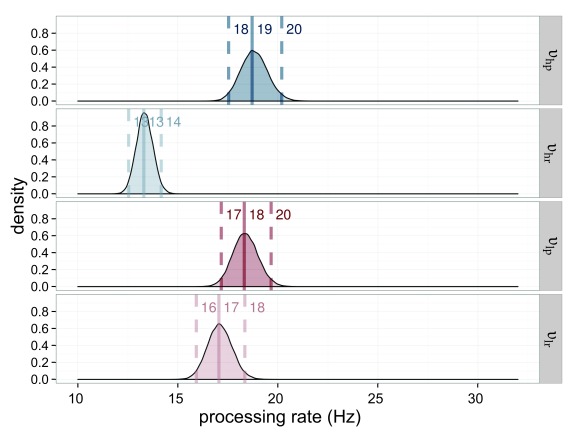
Figure 18.
Estimated processing rates (υ) for Experiment 4. The processing rates of the high-salience condition (υhp = rate for the highly salient probe; υhr = rate for the reference in the high-salient probe displays) are shown in blue, those of the low-salience condition (υlp = rate for the lowly salient probe; υlr = rate for the reference in the low-salient probe displays) in red. The darker distributions belong to the probe stimulus and the lighter distributions belong to the reference stimulus.

