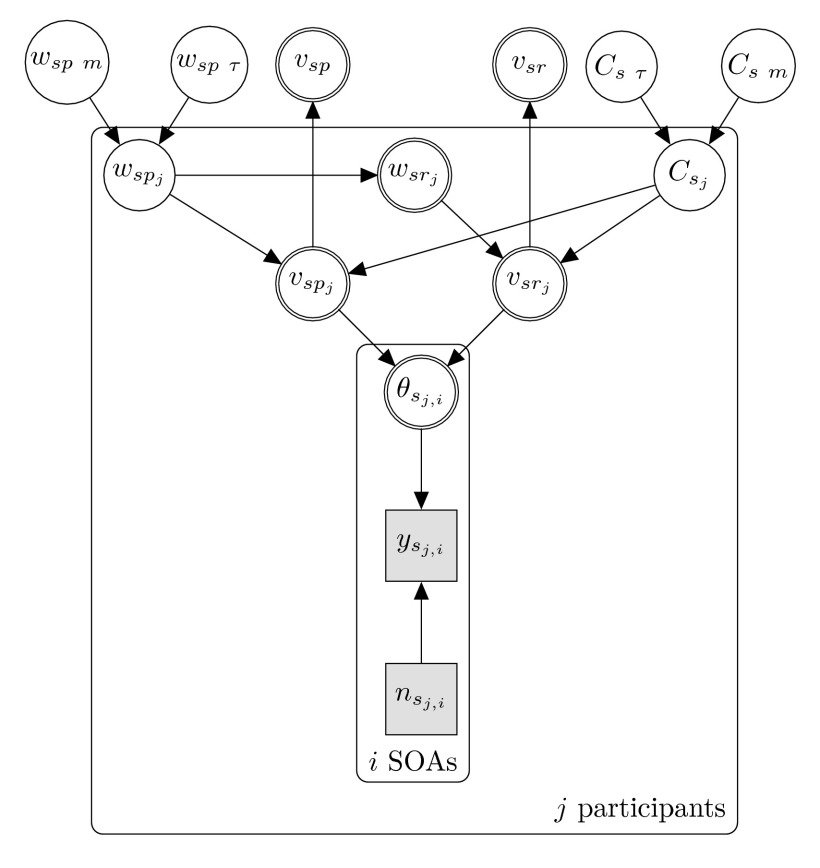
Figure 2.
Hierarchical Bayesian graphical model of the data of the salience condition. The salience condition is indicated by the index s . The same model applies for the neutral condition n. The group level, the variables in the highest layer, estimate TVA parameters for a particular condition. This layer was compared to the neutral condition (see Table 1). SOA = Stimulus Onset Asynchrony.

