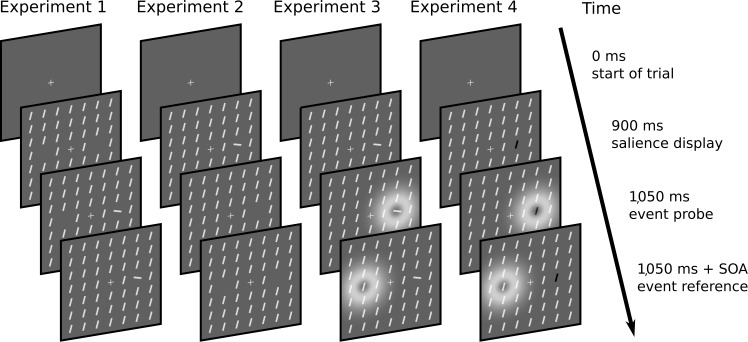
Figure 3.
Visualization of the stimulus sequence of Experiment 1 to 4. Stimuli are identical to those of the experiments, but displays have been scaled for visibility. The salience display was shown 150 ms before the probe event. The event to be judged was the onset (Experiment 1), offset (Experiment 2), or flicker (Experiment 3 and 4; depicted as white coronae). Only the salience conditions are shown. These conditions comprise a salient probe stimulus. The neutral conditions of the experiments featured a non-salient probe stimulus equal to the reference stimulus. These conditions are not depicted. The arrow depicts the flow of time. SOA = Stimulus Onset Asynchrony.

