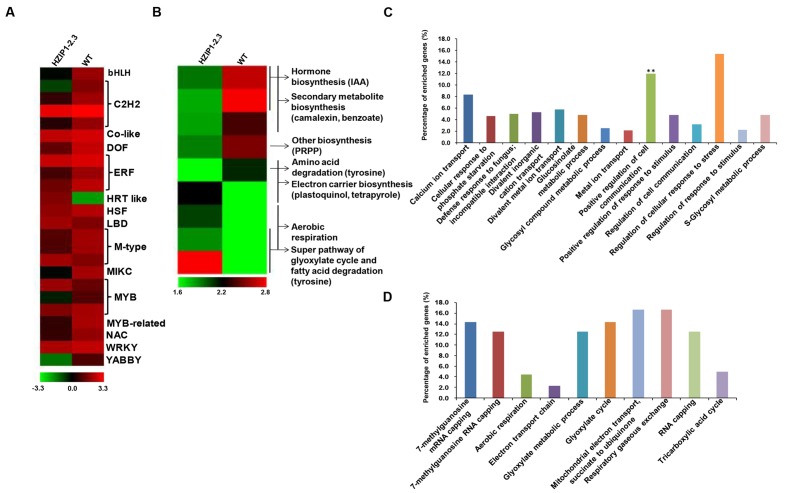
FIGURE 9.
Differential gene expression in 35S::OsHOX24 transgenic plants. (A,B) Heatmaps representing expression profiles of all the differentially expressed TFs (A) and genes involved in diverse metabolic pathways (B) in the transgenic line as compared to WT are shown. The color scale representing average log signal values is shown at the bottom. (C,D) GO (biological process) enrichment in differentially expressed genes in the transgenics. Significantly enriched GO terms (P-value ≤ 0.05) in biological process category among down-regulated (C) and up-regulated (D) genes are shown. The bar marked with asterisk indicate terms with high statistical significance (∗∗P-value ≤ 0.001).

