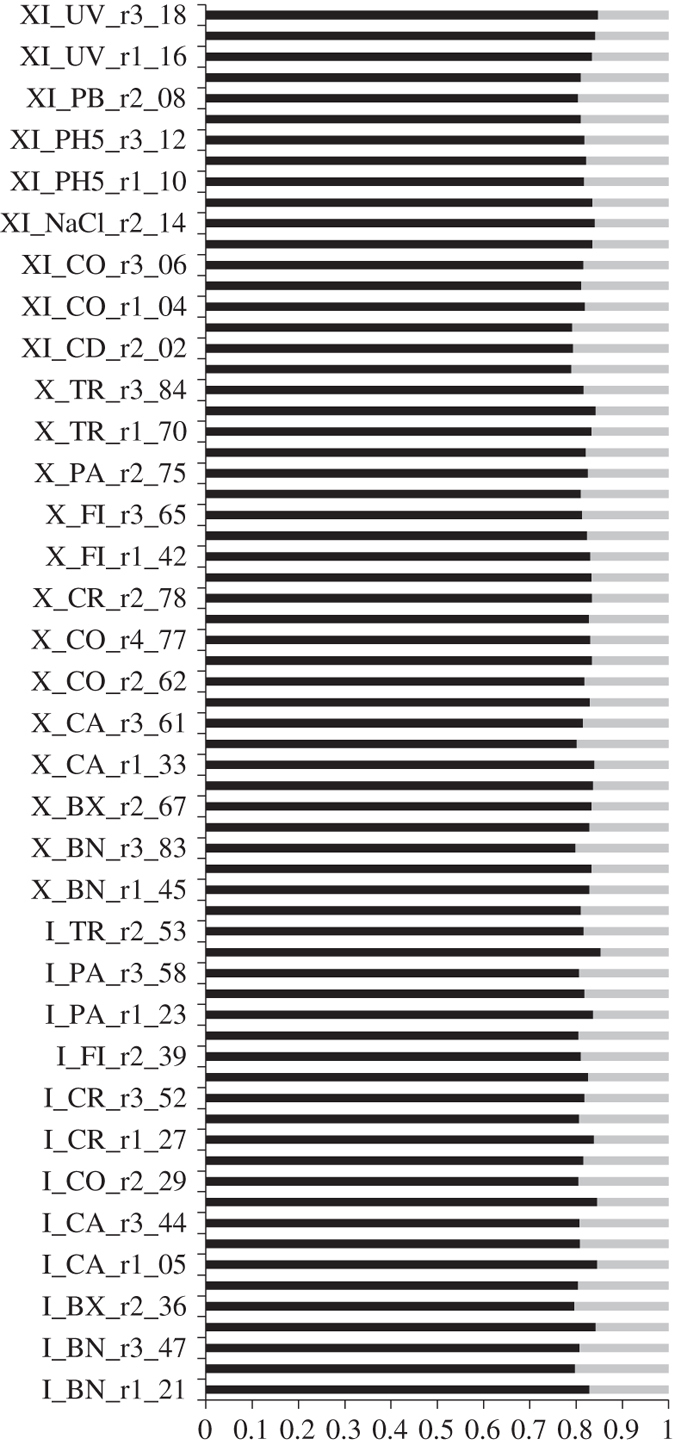
Figure 2. Percentage of mapped read pairs.

Percentage of read pairs per samples mapping to unique (black bars) or to multiple locations (grey bars) in the reference transcriptome of D. magna.

Percentage of read pairs per samples mapping to unique (black bars) or to multiple locations (grey bars) in the reference transcriptome of D. magna.