Figure 3.
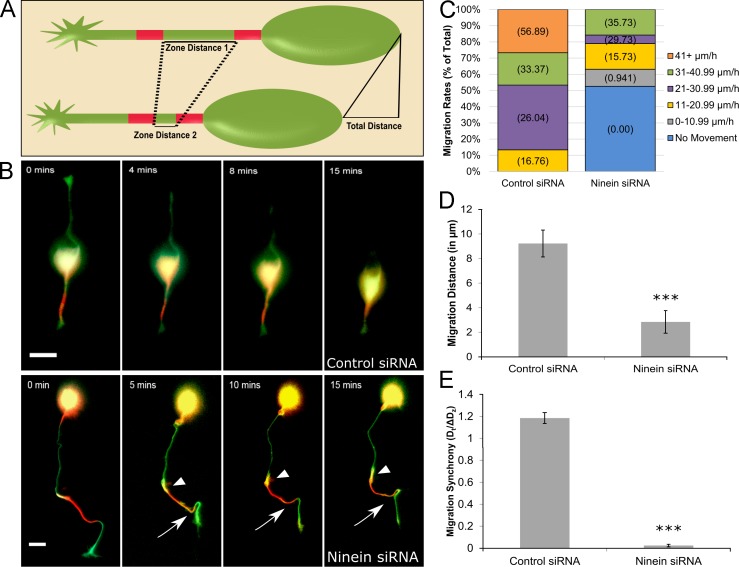
Ninein depletion compromises neuronal migration. (A) Schematic depicting the experimental paradigm. Under control conditions, the two red converted zones converge by a distance nearly equal to that of the total migration distance. (B, top) Cerebellar migratory neuron cotransfected with tdEos-tubulin and control siRNA. Minimal MT sliding occurs and soma moves forward. (bottom) Cerebellar migratory neuron cotransfected with tdEos-tubulin and ninein siRNA. Abnormal tortuosity of the leading process and increased MT sliding are observed (regions of yellow indicated by arrowheads [proximal] and arrows [distal]). Cells were imaged for 15 min. (C) Stacked bar graph showing migration rate distribution under control siRNA and ninein siRNA conditions. n = 20 per group. Numeral in parentheses represents the mean migration rate per category. (D) Bar graph depicting the total migration distance after treatment with control siRNA or ninein siRNA. ***, P < 0.0001 (n = 20 per group). (E) Bar graph of migration synchrony under control and ninein-depleted conditions. Total migration distance was divided by the change in zone distance. ***, P < 0.0001 (n = 20 per group). See also Video 2. Bars, 15 µm. Data are represented as mean ± SEM.

