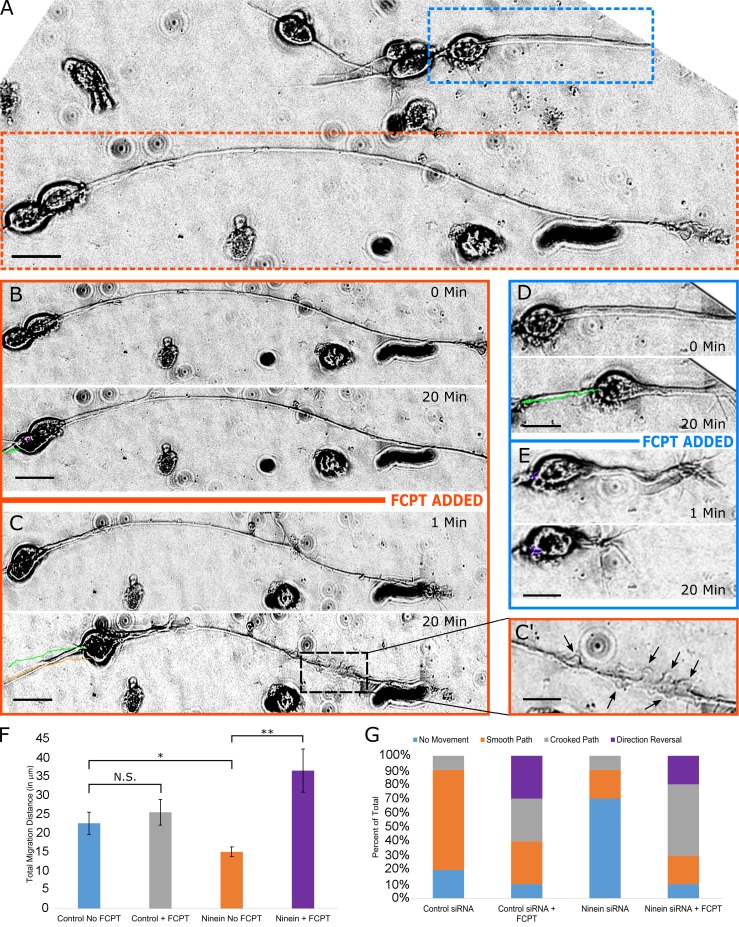
Figure 6.
FCPT restores soma migration of ninein-depleted neurons, but with abnormal characteristics. (A) Differential interference contrast image of cultured cerebellar migratory neurons. Different neuronal morphologies are observed. A neuron with a long leading process is seen at the bottom of A (orange box), whereas a neuron with a shorter leading process is observed at the top right (blue box). (B) A representative migratory neuron with a long leading process was imaged for 20 min under normal conditions. (C) FCPT was added to the same dish and imaged for 20 min. Significant movement of the soma is observed after ninein-depleted neurons are treated with FCPT (C, green and orange lines), and MT buckling can be observed along the leading process (indicated by black arrows in C′). (D) A neuron with a short leading process was treated as previously described. Movement is observed before addition of FCPT. (E) Upon addition of FCPT, MTs buckle in the leading process, and neuronal migration is compromised. (F) Bar graph depicting the total migration distance after treatment with control siRNA or ninein siRNA, with or without FCPT. (G) Stacked bar graph showing the distribution of migration subtypes (no movement, smooth path, crooked path, or direction reversal) after treatment with control siRNA or ninein siRNA, with or without FCPT. Brackets indicate statistical analyses between groups: N.S., not significant; *, P< 0.05; **, P < 0.01; n = 10 per group. Bars, 10 µm. Data are represented as mean ± SEM.

