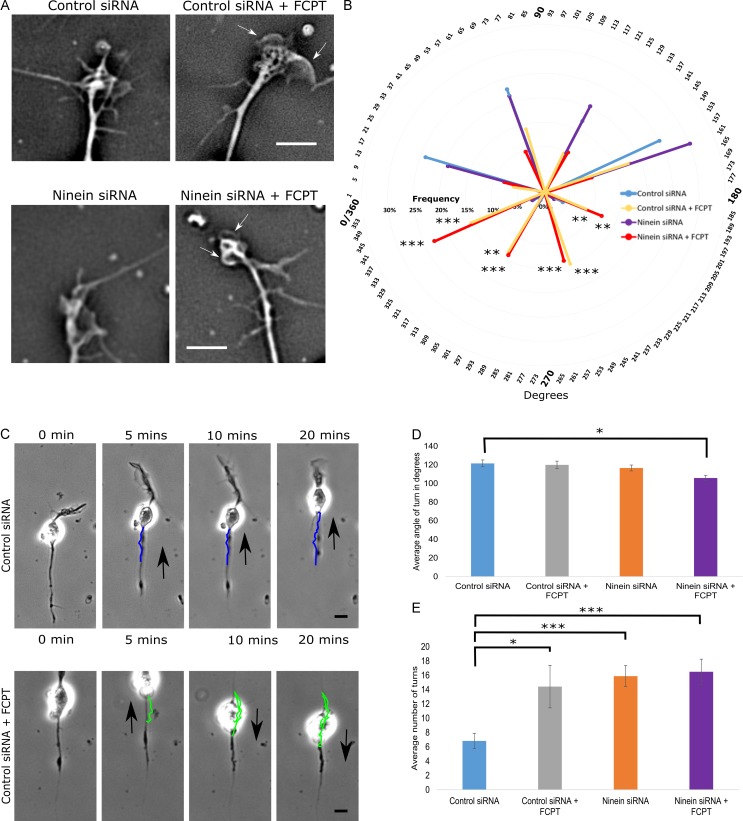
Figure 7.
Altering MT sliding impacts migration path and MT activity at the distal tip of the leading process. (A) Phase images of the distal tips of leading processes after treatment with control siRNA or ninein siRNA with and without FCPT. (B) 360° radar graph showing the mean frequency MTs were positioned in the following bins over 20 min of imaging: 0–45°, 46–90°, 91–135°, 136–180°, 181–225°, 226–270°, 271–315°, or 316–360°. FCPT treatment yielded a significant increase in the number of MTs positioned within the 180–360° region (also shown by white arrows in A). (C) Neuronal migration was tracked over 20 min using time-lapse phase imaging, and the migratory path was traced (colored lines) using Fiji tracking plugin. (top) Control siRNA-treated neuron. (bottom) Control siRNA-treated neuron + FCPT (black arrows indicate direction of migration). (D) Graph showing the mean angle of observed turns during a 20 min bout of migration. Mean turn angle was significantly sharper when ninein-depleted neurons were treated with FCPT. (E) Bar graph displaying the mean number of turns made by migratory neurons during a 20 min bout of migration. Neurons treated with control siRNA showed the fewest number of turns. Treating control neurons with FCPT, depleting ninein, and treating ninein-depleted neurons with FCPT all significantly increased the mean number of turns observed during the 20 min bout of migration. n = 15 per group; *, P < 0.05; **, P < 0.01; ***, P < 0.001. Bars: (A) 5 µm; (C) 10 µm. Data are represented as mean ± SEM.

