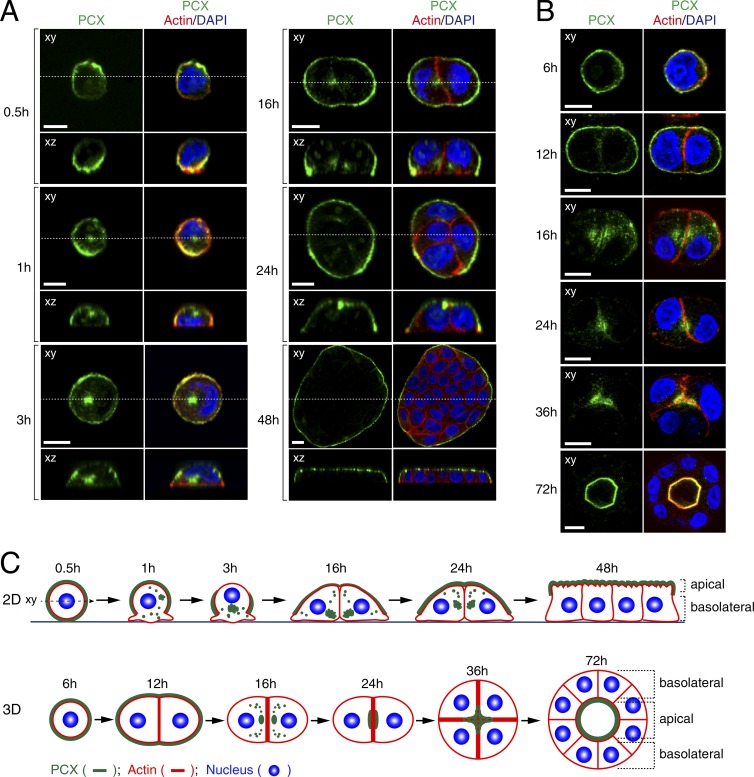
Figure 1.
Subcellular localization of endogenous PCX at consecutive time points in MDCK II cells growing in 2D monolayers and in 3D cysts. (A and B) MDCK II cells were plated on glass-bottom dishes (A) or on Matrigel-coated glass slides (B) and fixed with PFA at the times indicated. The cells were then stained with anti-PCX antibody (green), Texas red–conjugated phalloidin (red), and DAPI (blue). The confocal xy section (top) and the xz section (bottom), which corresponds to the dashed line in the xy section, of 2D cell cultures are shown. Bars, 10 µm. The specificity of the anti-PCX antibody is shown in Fig. S1 A. (C) Schematic models presenting PCX localization during cell polarization into 2D monolayers (xz view; top) and 3D cysts (xy view; bottom). PCX is shown in green, actin in red, and the nucleus in blue.

