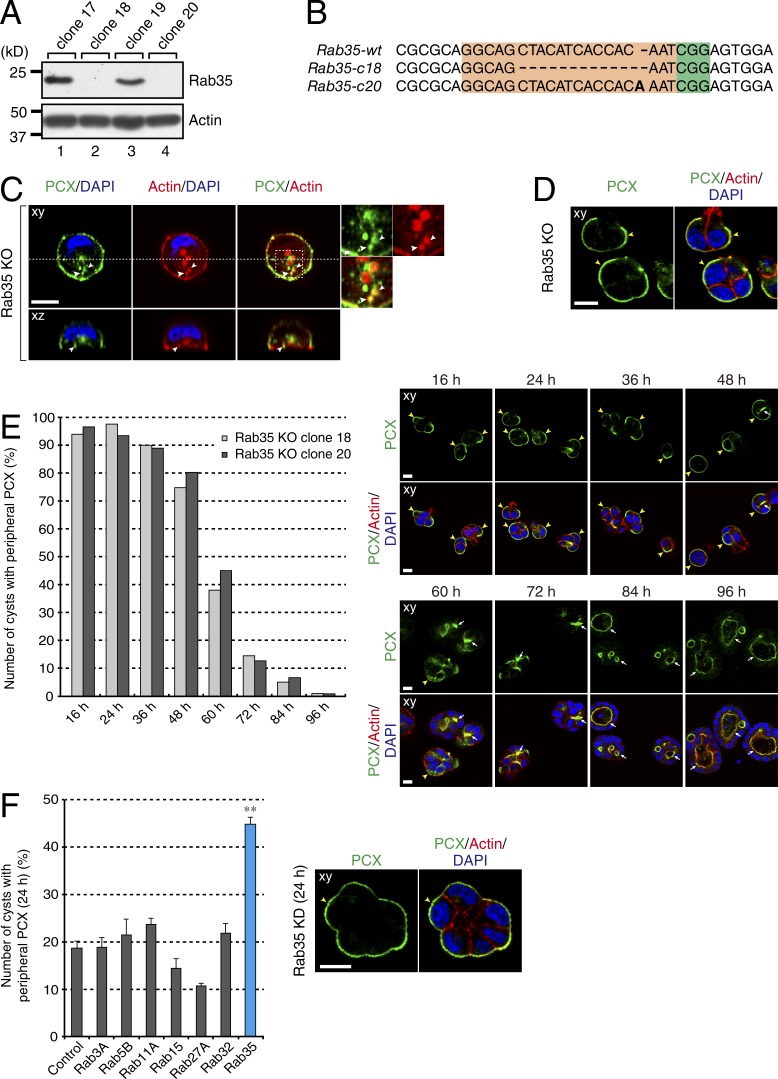
Figure 6.
Characterization of Rab35-KO MDCK II cells. (A) The Rab35 gene in MDCK II cells had been specifically disrupted by CRISPR/Cas9 system and the levels of Rab35 protein in selected clones were verified by immunoblotting with specific antibody against Rab35. The KO was successful in clones 18 and 20. (B) Cas9 target sequence against the Rab35 gene (Rab35-wt) and its disruption observed in clones 18 (Rab35-c18: 12 nucleotides deletion) and 20 (Rab35-c20: one nucleotide insertion). The target and PAM sequences are highlighted in orange and green, respectively. (C and D) Rab35-KO clone 20 cells were plated on glass-bottom dishes (C) or Matrigel-coated glass slides (D) and fixed with PFA 3 h (C) or 24 h (D) after plating. The cells were then stained with anti-PCX antibody (green), Texas red–conjugated phalloidin (red), and DAPI (blue). The arrowheads in C point to PCX dots that localize at actin-rich structures, and the yellow arrowheads in D point to peripheral PCX. (E) Rab35 KO clone 18 or 20 cells were plated on Matrigel-coated glass slides and fixed with PFA at the times indicated. The cells were then stained with anti-PCX antibody, and the cysts with peripheral PCX were counted (left graph). Bars on the graph represent the number of cysts (%) with peripheral PCX scored once for each clone (n > 150). Note that the degree of polarity reversal, which occurs with increased culturing time, is comparable for both clones. The microscopic images on the right side of the graph show representative phenotypes of the clone 20. The white arrows and yellow arrowheads point apical PCX and peripheral PCX, respectively. (F) MDCK II cells that had been treated with indicated Rab siRNA, were plated on Matrigel-coated glass slides and fixed with PFA 24 h after plating. The cells were then stained with anti-PCX antibody and the cysts with peripheral PCX were counted. Values represent the mean and SEM of at least three independent experiments (n > 100 in each experiment). Significance was determined by one-way analysis of variance with Dunnett's post-test at 95% confidence interval. **, P < 0.01. The microscopic images on the right side of the graph shows a representative Rab35-KD cyst 24 h after seeding. The yellow arrowhead points peripheral PCX. Bars: 10 µm; (insets) 1 µm.

