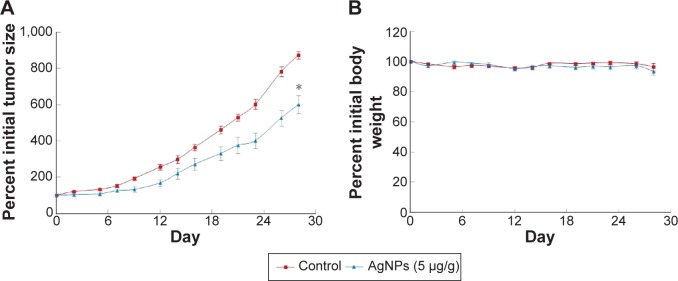
Figure 6.
Effects of ip administration of AgNPs on the progression and growth of H1299 tumors.
Notes: (A) Growth curve of H1299 tumors in each group. Each value is mean ± SE from eight mice. (B) Individual body weight of mice after treatment for 28 days. *P<0.05.
Abbreviations: AgNPs, silver nanoparticles; ip, intraperitoneal.

