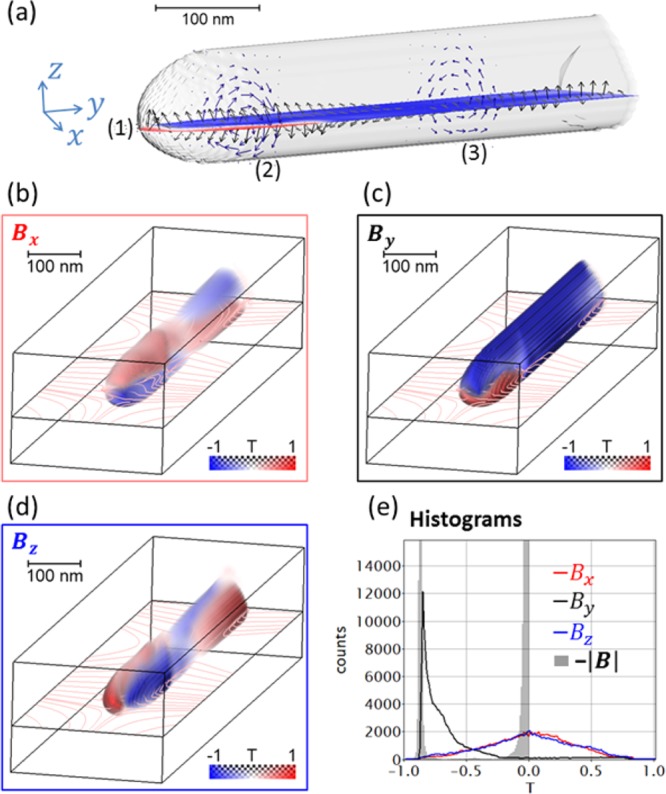
Figure 5.

Induction map B of the Co NW obtained from micromagnetic simulation. (a) Iso-surface with longitudinal slice (1) representing By and cross sections (2) and (3) visualized by arrow plots. In slice (1), the out-of-plane components are displayed as vectors. In the cross sections (2) and (3), the twist of magnetic induction is illustrated by the opposite azimuthal direction of the vectors. (b-d) Volume rendering of the three B-field components with field lines in the x-y plane. (e) Histograms of B-field components and negative of the total magnitude.
