
Figure 1.
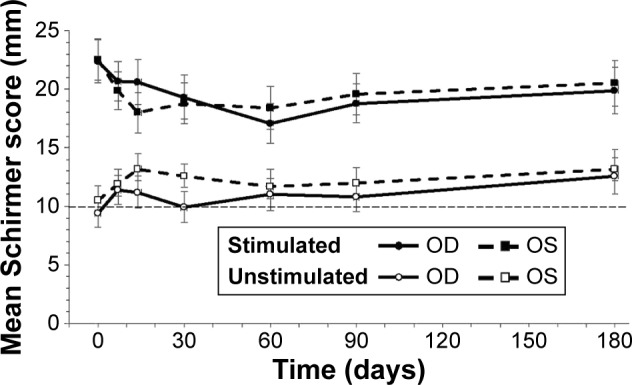
Schirmer scores with and without stimulation.
Notes: The difference between the stimulated and unstimulated Schirmer score for each eye was statistically significant at all time points (P<0.001). Data represents mean ± SEM. The thin dashed horizontal reference line represents the mean unstimulated value for both eyes at day 0.
Abbreviations: OD, right eye; OS, left eye; SEM, standard error of the mean.