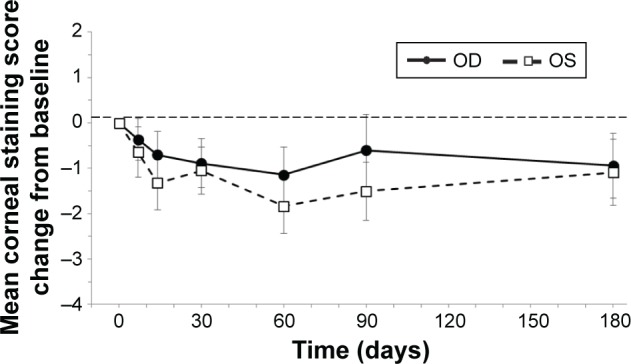
Figure 2.

Corneal staining.
Notes: Corneal staining scores were numerically reduced from baseline in both eyes at all time points after day 7. Bars represent SEM. The thin dashed horizontal reference line represents the baseline value at day 0.
Abbreviations: OD, right eye; OS, left eye; SEM, standard error of the mean.
