
Figure 3.
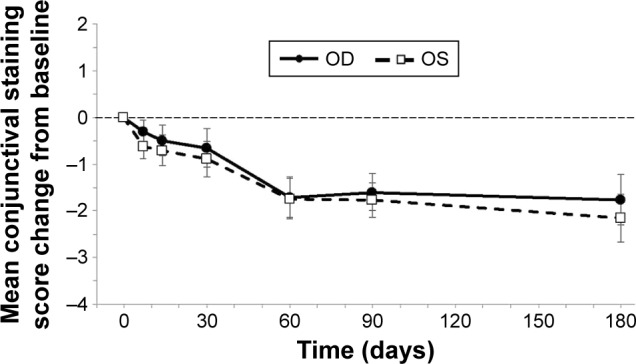
Conjunctival staining.
Notes: Conjunctival staining scores were significantly reduced from baseline in both eyes at all time points after day 30 (P<0.05). At day 180, the mean changes from baseline ranged from −1.8±0.5 to −2.2±0.51 (P=0.002). Bars represent SEM. The thin dashed horizontal reference line represents the baseline value at day 0.
Abbreviations: OD, right eye; OS, left eye; SEM, standard error of the mean.