
Figure 5.
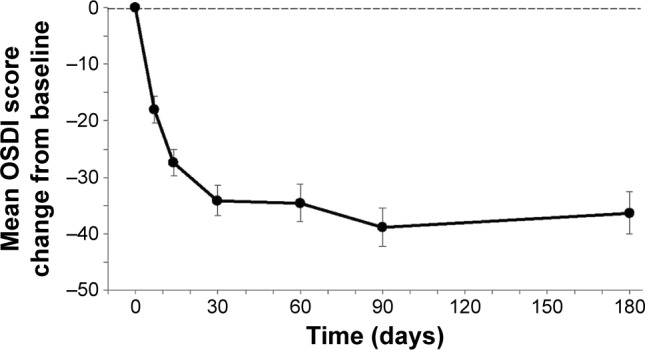
DED severity (OSDI score).
Notes: Mean changes in OSDI scores from baseline were statistically significant (P<0.001) at all time points after the baseline (day 0) visit. The thin dashed horizontal reference line represents the baseline value at day 0 (OSDI raw score at day 0=69.3±2.6). Bars represent SEM.
Abbreviations: DED, dry eye disease; OSDI, Ocular Surface Disease Index; SEM, standard error of the mean.