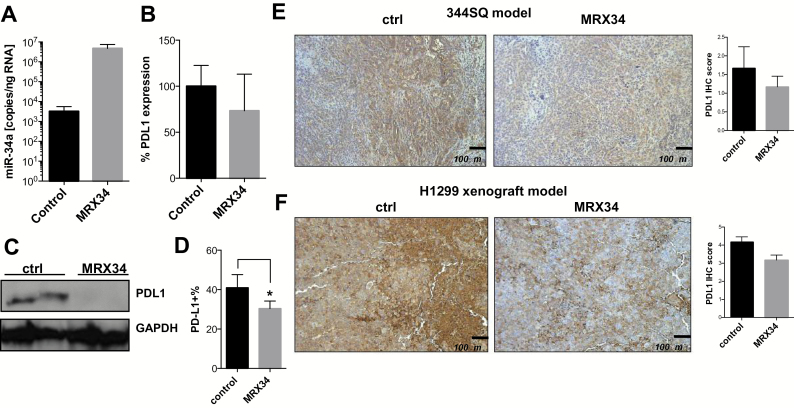
Figure 4.
PDL1 expression after in vivo delivery of miR-34a. Analysis of miR-34a and PDL1 expression levels in subcutaneous 344SQ tumors treated with MRX34 (n = 2) by quantitative polymerase chain reaction (A), by western blotting (C), by flow cytometry (B) (P = .04, n = 2; an unpaired t test was used to calculate the two-sided P value) (D), or by immunohistochemical staining (E) in a syngeneic mouse model. Scale bar = 200 μm. F) MRX34-induced downregulation of PDL1 in an H1299 xenograft model described elsewhere (37). Magnification ×100. Scale bar = 100 μm. *P < .05. Error bars on the bar charts represent standard deviation. ctrl = control; IHC = immunohistochemistry; MRX34 = miR-34a–loaded liposomes.

