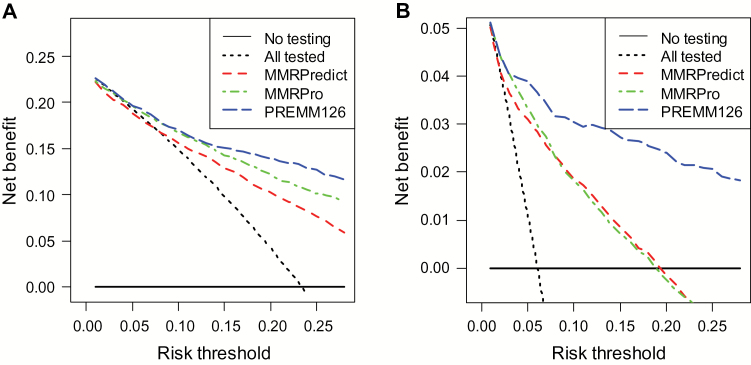
Figure 3.
Net benefit analyses comparing MMRPredict, MMRPro, and PREMM1,2,6 to identify mismatch repair mutation carriers at different risk thresholds. A and B) Display of the net benefit curves comparing the three prediction models among the clinic-based cohort. The y-axis measures net benefit, which is calculated by summing the benefits (true positives) and subtracting the harms (false positives), where the latter are weighted by a factor related to the relative harm of a missed mutation carrier compared with the harm of unnecessary genetic testing. A model is considered of clinical value if it has the highest net benefit compared with other models and simple strategies such as performing genetic testing in all patients (dashed black line) or no patients (horizontal black line) across the full range of threshold probabilities at which a patient would undergo genetic testing. For example, the net benefit of using PREMM1,2,6 or MMRPro to selectively test for mutation carriers exceeds that of testing all at a risk of 5% or higher. A) The net benefit at the 10% threshold is 0.18 for PREMM1,2,6 vs 0.15 for testing all and 0 for testing none among clinic-based cases. The net benefit of the PREMM1,2,6 model over testing all is thus 0.03, which means that three individuals would be identified as mutation carriers for every 100 people assessed with PREMM1,2,6 without an increase in the number of false-positive results. At the 10% threshold, this calculation assumes that we value a true-positive classification worth incurring up to nine false-positives (since 1:9, which is the odds corresponding to a probability of 10%). B) Display of the net benefit curves for the three models among the population-based cohort. The benefit at the 10% threshold is 0.02 for PREMM1,2,6 vs 0 for testing all and 0 for testing none. This means that two individuals would be identified as mutation carriers for every 100 people assessed with PREMM1,2,6 without an increase in the number of false positives.

