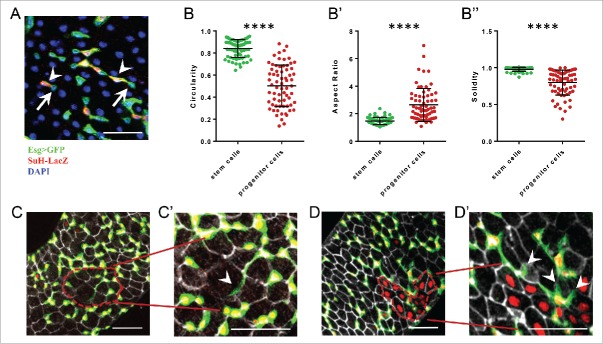
Figure 1.
Progenitor cells have a marked planar cell polarity characterized by long protrusions and can sense the surrounding epithelial cells determining where to differentiate. A) Intestinal stem (ISC) and progenitor cells (EB) are marked by escargot-GAL4>UAS-CD8::GFP while EB co-stain with a Su(H)-LacZ reporter. Arrows indicate ISCs, arrowheads EBs. B-B″) Comparative morphological analysis of stem vs. progenitor cells. Bars represent mean and standard deviation of the mean. B) Circularity describes how close the relation between the area and perimeter of the cell shape is to that of a perfect circle. B′) Aspect ratio reflects the degree of elongation. B″) Solidity describes convexity of the cell shape. C-C′) An EB sending a long protrusion (arrowhead) toward a not yet replenished area which has lower density of EBs (red dashed line). D-D′) EBs which protrusions are likely repulsed (arrowheads) from areas which have already been replenished (red dashed area). **** = p-value <0.0001 (2 tails unpaired T-test). Scalebar = 50 µM.

