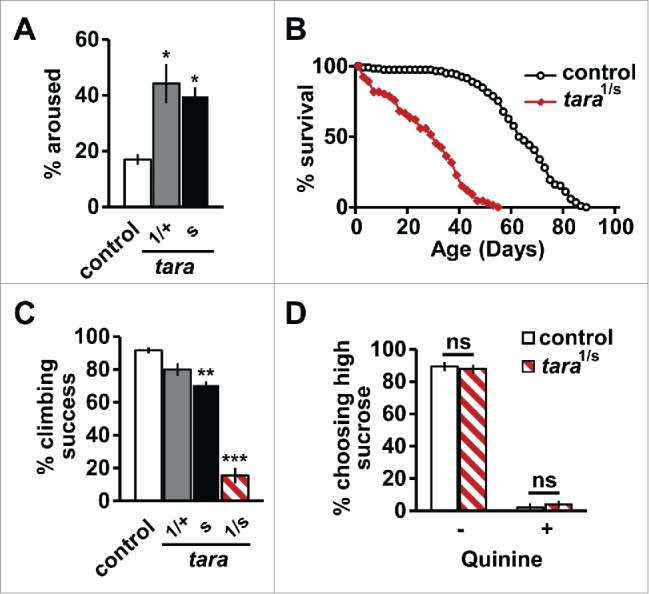
Figure 1.

Behavioral phenotypes of tara mutants. (A) Percentage of control and tara flies (n=31−64) that were awakened by a 1 sec pulse of 100 lux light delivered at ZT16. Only flies that were asleep prior to the light pulse are included. (B) Survivorship curves of female control and tara1/s132 flies (n = 66−118). (C) Percentage of control, tara1/+, taras132, and tara1/s132 flies (n = 37−50) that crossed a 10 cm mark within 10 sec against gravity. (D) Percentage of control and tara1/s132 flies (n = 46−68) that chose food with 25 mM sucrose, in the absence or presence of 3 mM quinine, over 5 mM sucrose. Control and tara flies showed an equivalent preference for a higher concentration of sugar and an equivalent avoidance of bitter tasting quinine. Mean ± SEM is shown. *p < 0.05, **p < 0.01, ***p < 0.001, Chi-square test (A, D), log rank test (B), and one-way ANOVA followed by Dunnett post hoc test relative to control flies (C).
