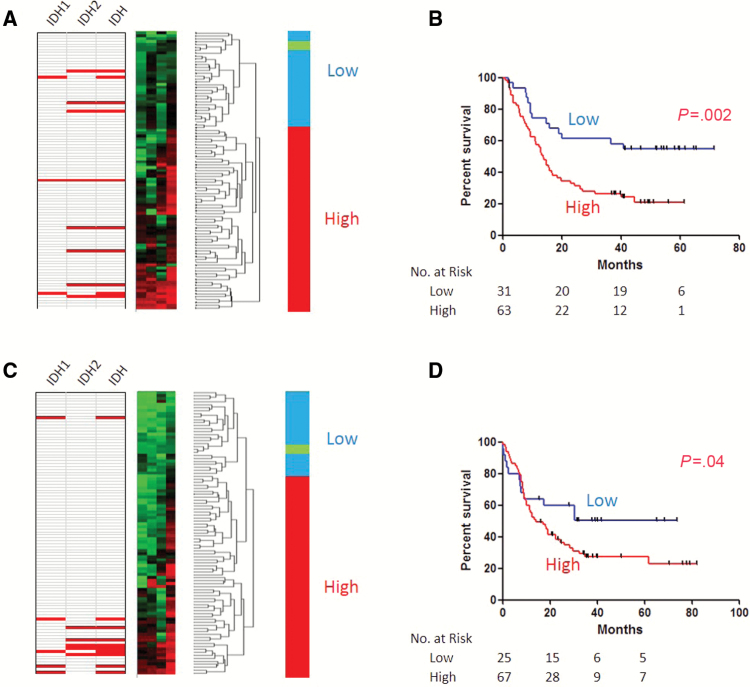
Figure 1.
DNA methylation signatures for TET2-specific differentially methylated CpGs (tet2-DMC)-low and -high patients in acute myeloid leukemia (AML). Hierarchical clustering analyses (left) in the test cohort (A) and the validation cohort (C) were used for classifying tet2-DMC–low (blue) and –high (red) patients. Note that normal peripheral blood (green) clustered with tet2-DMC–low patients. Mutation status for IDH1, IDH2, or IDH1/2 are shown on the left for each case (red indicates mutation). Tet2-DMC–low patients showed statistically longer overall survival compared with tet2-DMC–high in the test cohort (B) and the validation cohort (D). P values are derived from the two-sided log-rank test.

