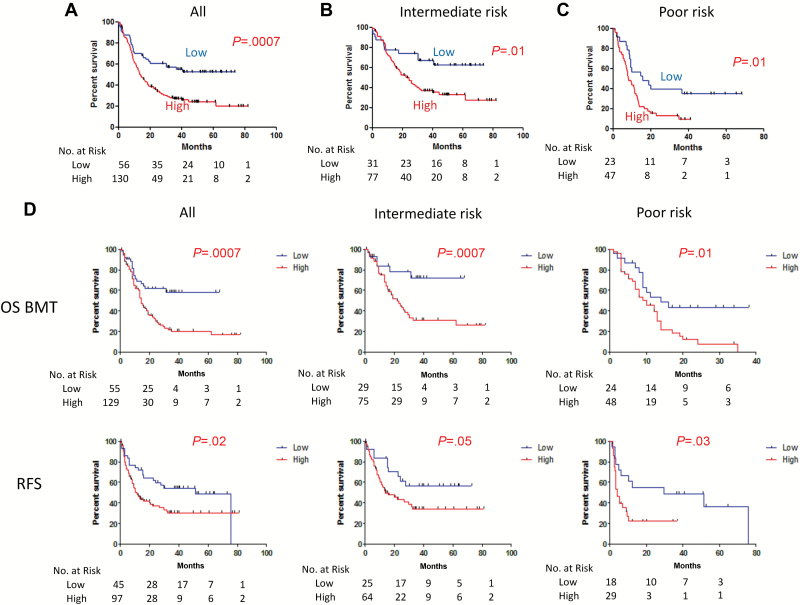
Figure 2.
Kaplan-Meier survival curves for TET2-specific differentially methylated CpGs (tet2-DMC)-low (blue) and -high (red) patients in the combined cohorts. Tet2-DMC–low patients showed statistically longer overall survival (OS) compared with tet2-DMC–high in the analysis with all patients (A) in the intermediate-risk cytogenetics group (B) and the poor-risk cytogenetics group (C). D) Kaplan-Meier survival curves for OS adjusted based on bone marrow transplantations censoring and recurrence-free survival are shown in the upper and lower rows, respectively, in the analysis with all patients (left column), in the intermediate-risk cytogenetics group (center column), and the poor-risk cytogenetics group (right column), respectively. P values are derived from two-sided log-rank test. OS BMT = overall survival adjusted for bone marrow transplantations censoring; RFS = recurrence-free survival.

