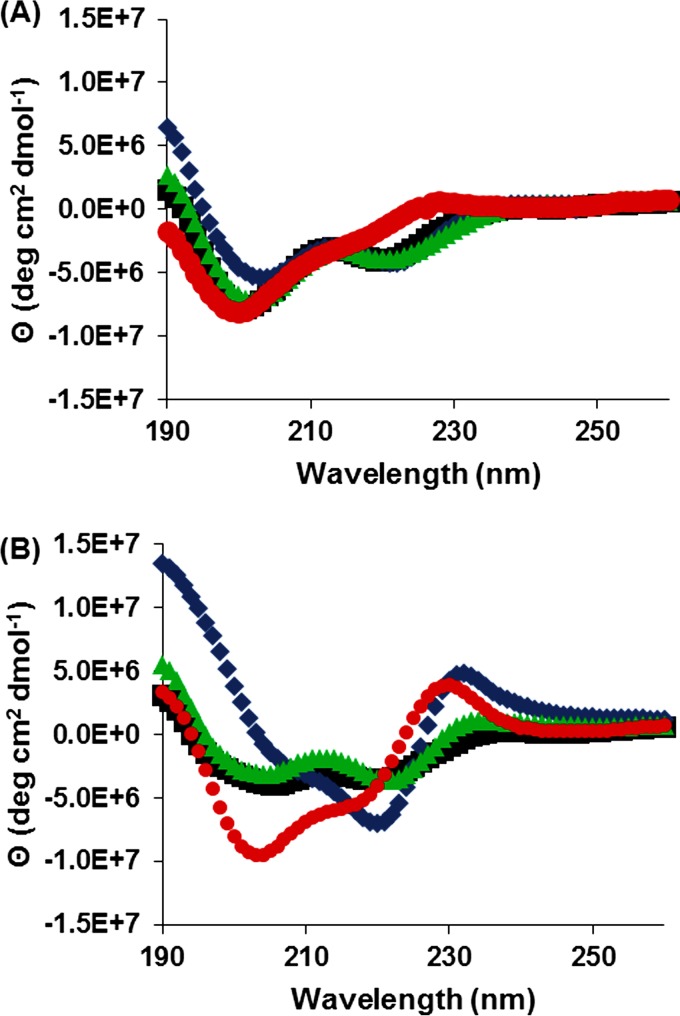
FIG 3.
Secondary structure analysis. Shown are far-UV CD spectra for B1 (■), B2 (◆), B3 (▲), and B4 (●) in phosphate buffer (A) and at a 1:10 P:L ratio with POPC-POPG lipids at a 3:1 molar ratio (B). B1 to B3 in phosphate buffer resulted in linear α-helical spectra, while B4's spectrum resembled that of a random coil. In the presence of lipids, B1 and B3 maintained their linear helical spectra, while B2 and B4 produced spectra resembling kinked helices.

