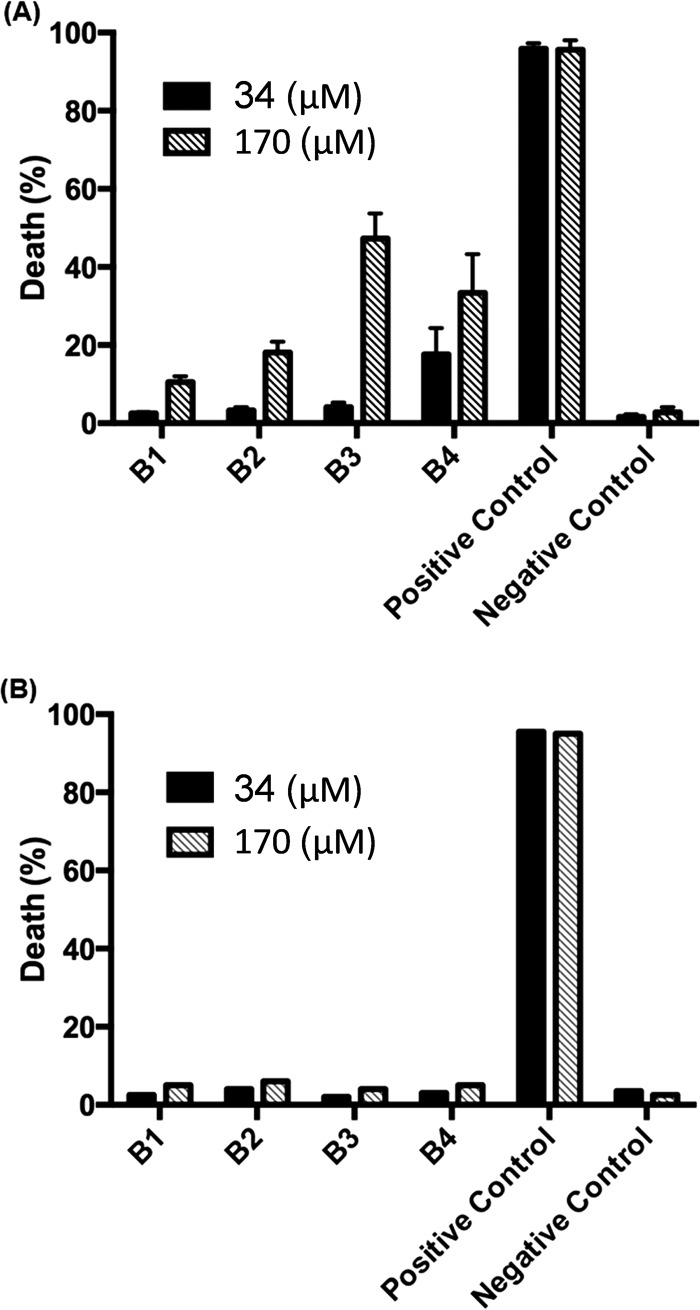
FIG 5.
AMP cytotoxicity. Shown is AMP cytotoxicity against J774.16 macrophage cells (A) and A549 lung epithelial cells (B) at 34 μM (black bars) and 170 μM (white striped bars) AMP concentrations. The positive control is 1% Triton X-100 or 50 μM NaN3, while the negative control is cell medium in all cases. Error bars represent 1 standard deviation from three biological replicates.

