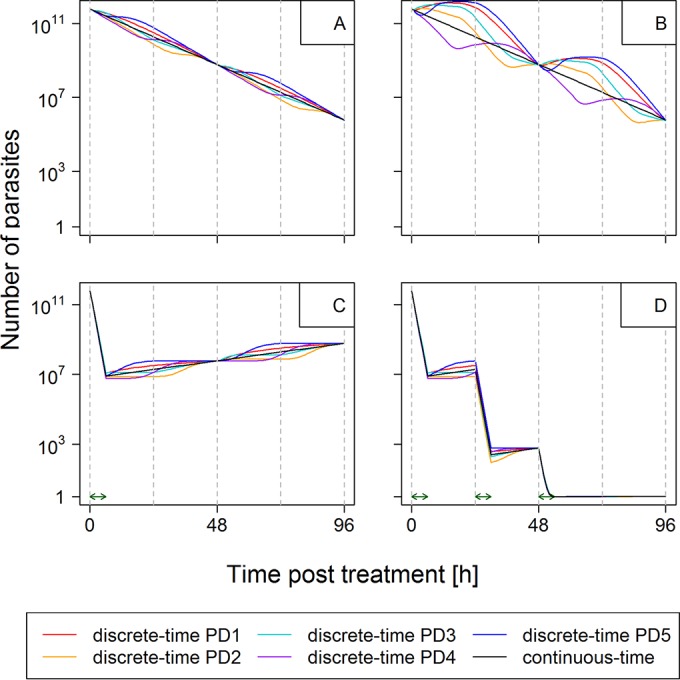
FIG 2.

Changes in parasite numbers following treatment. The graph shows the number of parasites over time posttreatment. Parasites present at the time of treatment were distributed among age bins according to PD1 to PD5 (see Section 1 in the supplemental material). Note that the number of parasites is the true number, i.e., circulating plus sequestered, plus 1 [it is conventional to plot parasites + 1 when using a log scale because log(0) is undefined]. (A) Drug with a long half-life and equal killing in all age bins (e.g., hypothetical drug 1). This was produced by using the pharmacodynamic profile of hypothetical drug 1. The discrete-time model used a drug killing rate, V′max, of 0.1919 and a Yb of 1 for age bins 1 to 48, and the continuous-time model used a drug killing rate, Vmax, of 0.1919. (B) Drug with a long half-life and stage-specific killing (e.g., lumefantrine). This was produced by using the pharmacodynamic profile of the drug lumefantrine. The discrete-time model used a drug killing rate, V̂′max, of 0.4005, a Yb of 1 for age bins 18 to 40 inclusive, and a Yb of 0 for age bins 0 to 17 and 41 to 48 inclusive, and the continuous-time model used a drug killing rate, V̂max, of 0.1919. (C) Drug with a short half-life and equal killing in all age bins (i.e., hypothetical drug 2), given as a single dose and assuming that the drug is present and acting at maximal killing for 6 h posttreatment (15). The discrete-time model used a drug killing rate, Ṽ′max, of 0.1919; a Yb of 1 for age bins 1 to 48; and a Zb of 1 for the 6 h that the drug was present, and the continuous-time model used a drug killing rate, Ṽmax, of 1.919 for a single dose administered at time zero (green arrow). (D) Same as for panel C but with three doses administered at 0, 24, and 48 h (green arrows).
