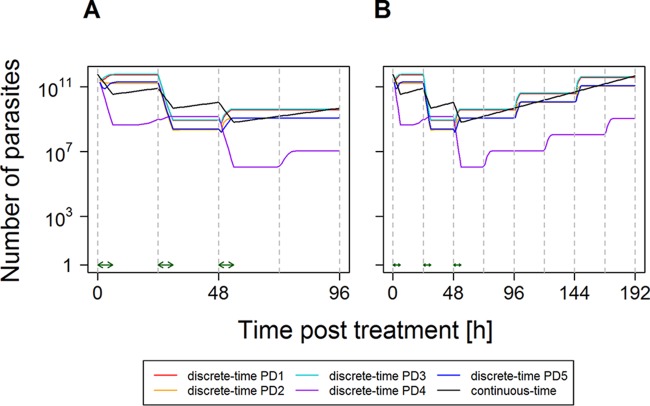
FIG 3.
Changes in parasite numbers following treatment by a drug with a short half-life and stage-specific killing (e.g., artemisinin derivative). This was produced by using the isosensitive pharmacodynamic profile of the artemisinins (Fig. 1) and assuming that the drug is present and acting at maximal killing for 6 h after each dose (15). Artemisinins are simulated as a monotherapy for clarity. They can later be combined to simulate combination therapies (12), so parasite numbers start to increase shortly after the final dose. Parasites present at the time of treatment were distributed among age bins according to PD1 to PD5 (see Section 1 in the supplemental material). The continuous-time model used a single-drug killing rate,  max, of 0.52408, i.e., the one calibrated to give a PRR48 of 104 for a uniform distribution (Table 2). Note that the number of parasites is the true number, i.e., circulating plus sequestered, plus 1 [it is conventional to plot parasites + 1 when using a log scale because log(0) is undefined]. (A) Dynamics in detail up to 96 h; (B) how parasite numbers remain separate thereafter.

