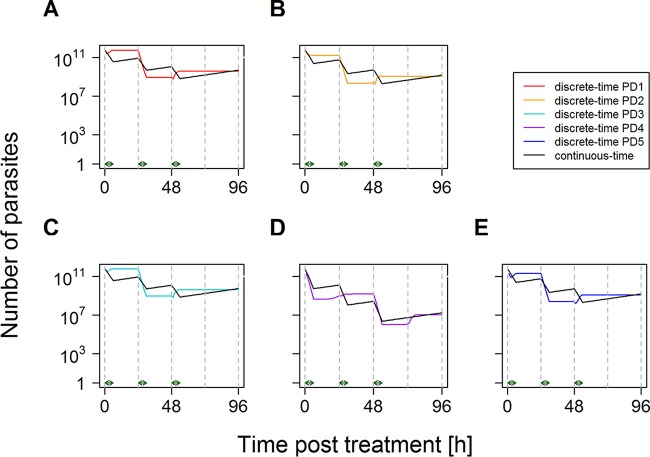
FIG 4.
Changes in parasite numbers following treatment by a drug with a short half-life and stage-specific killing with continuous-time approximation corrected for patients' differing bin distributions at the time of treatment. This was produced by using the isosensitive pharmacodynamic profile of the artemisinins (Fig. 1) and assuming that the drug is present and acting at maximal killing for 6 h after each dose (15). Parasites present at the time of treatment were distributed among age bins according to PD1 to PD5 as described in the text. Unlike Fig. 3, the discrete-time analysis of stage specificity and its continuous-time approximation reconverge at 96 h for each paradigm distribution. The artemisinins have disappeared from the circulation by this time, so the continuous-time approximation captures the total amount of artemisinin drug killing. These examples use the continuous-time kill rate,  max,96, appropriate for each distribution (Table 2), i.e., a
  max,96 of 0.524 for PD1 (A), a
  max,96 of 0.591 for PD2 (B), a
  max,96 of 0.518 for PD3 (C), a
  max,96 of 0.837 for PD4 (D), and a
  max,96 of 0.588 for PD5 (E). Note that the number of parasites is the true number, i.e., circulating plus sequestered, plus 1 [it is conventional to plot parasites + 1 when using a log scale because log(0) is undefined].

